
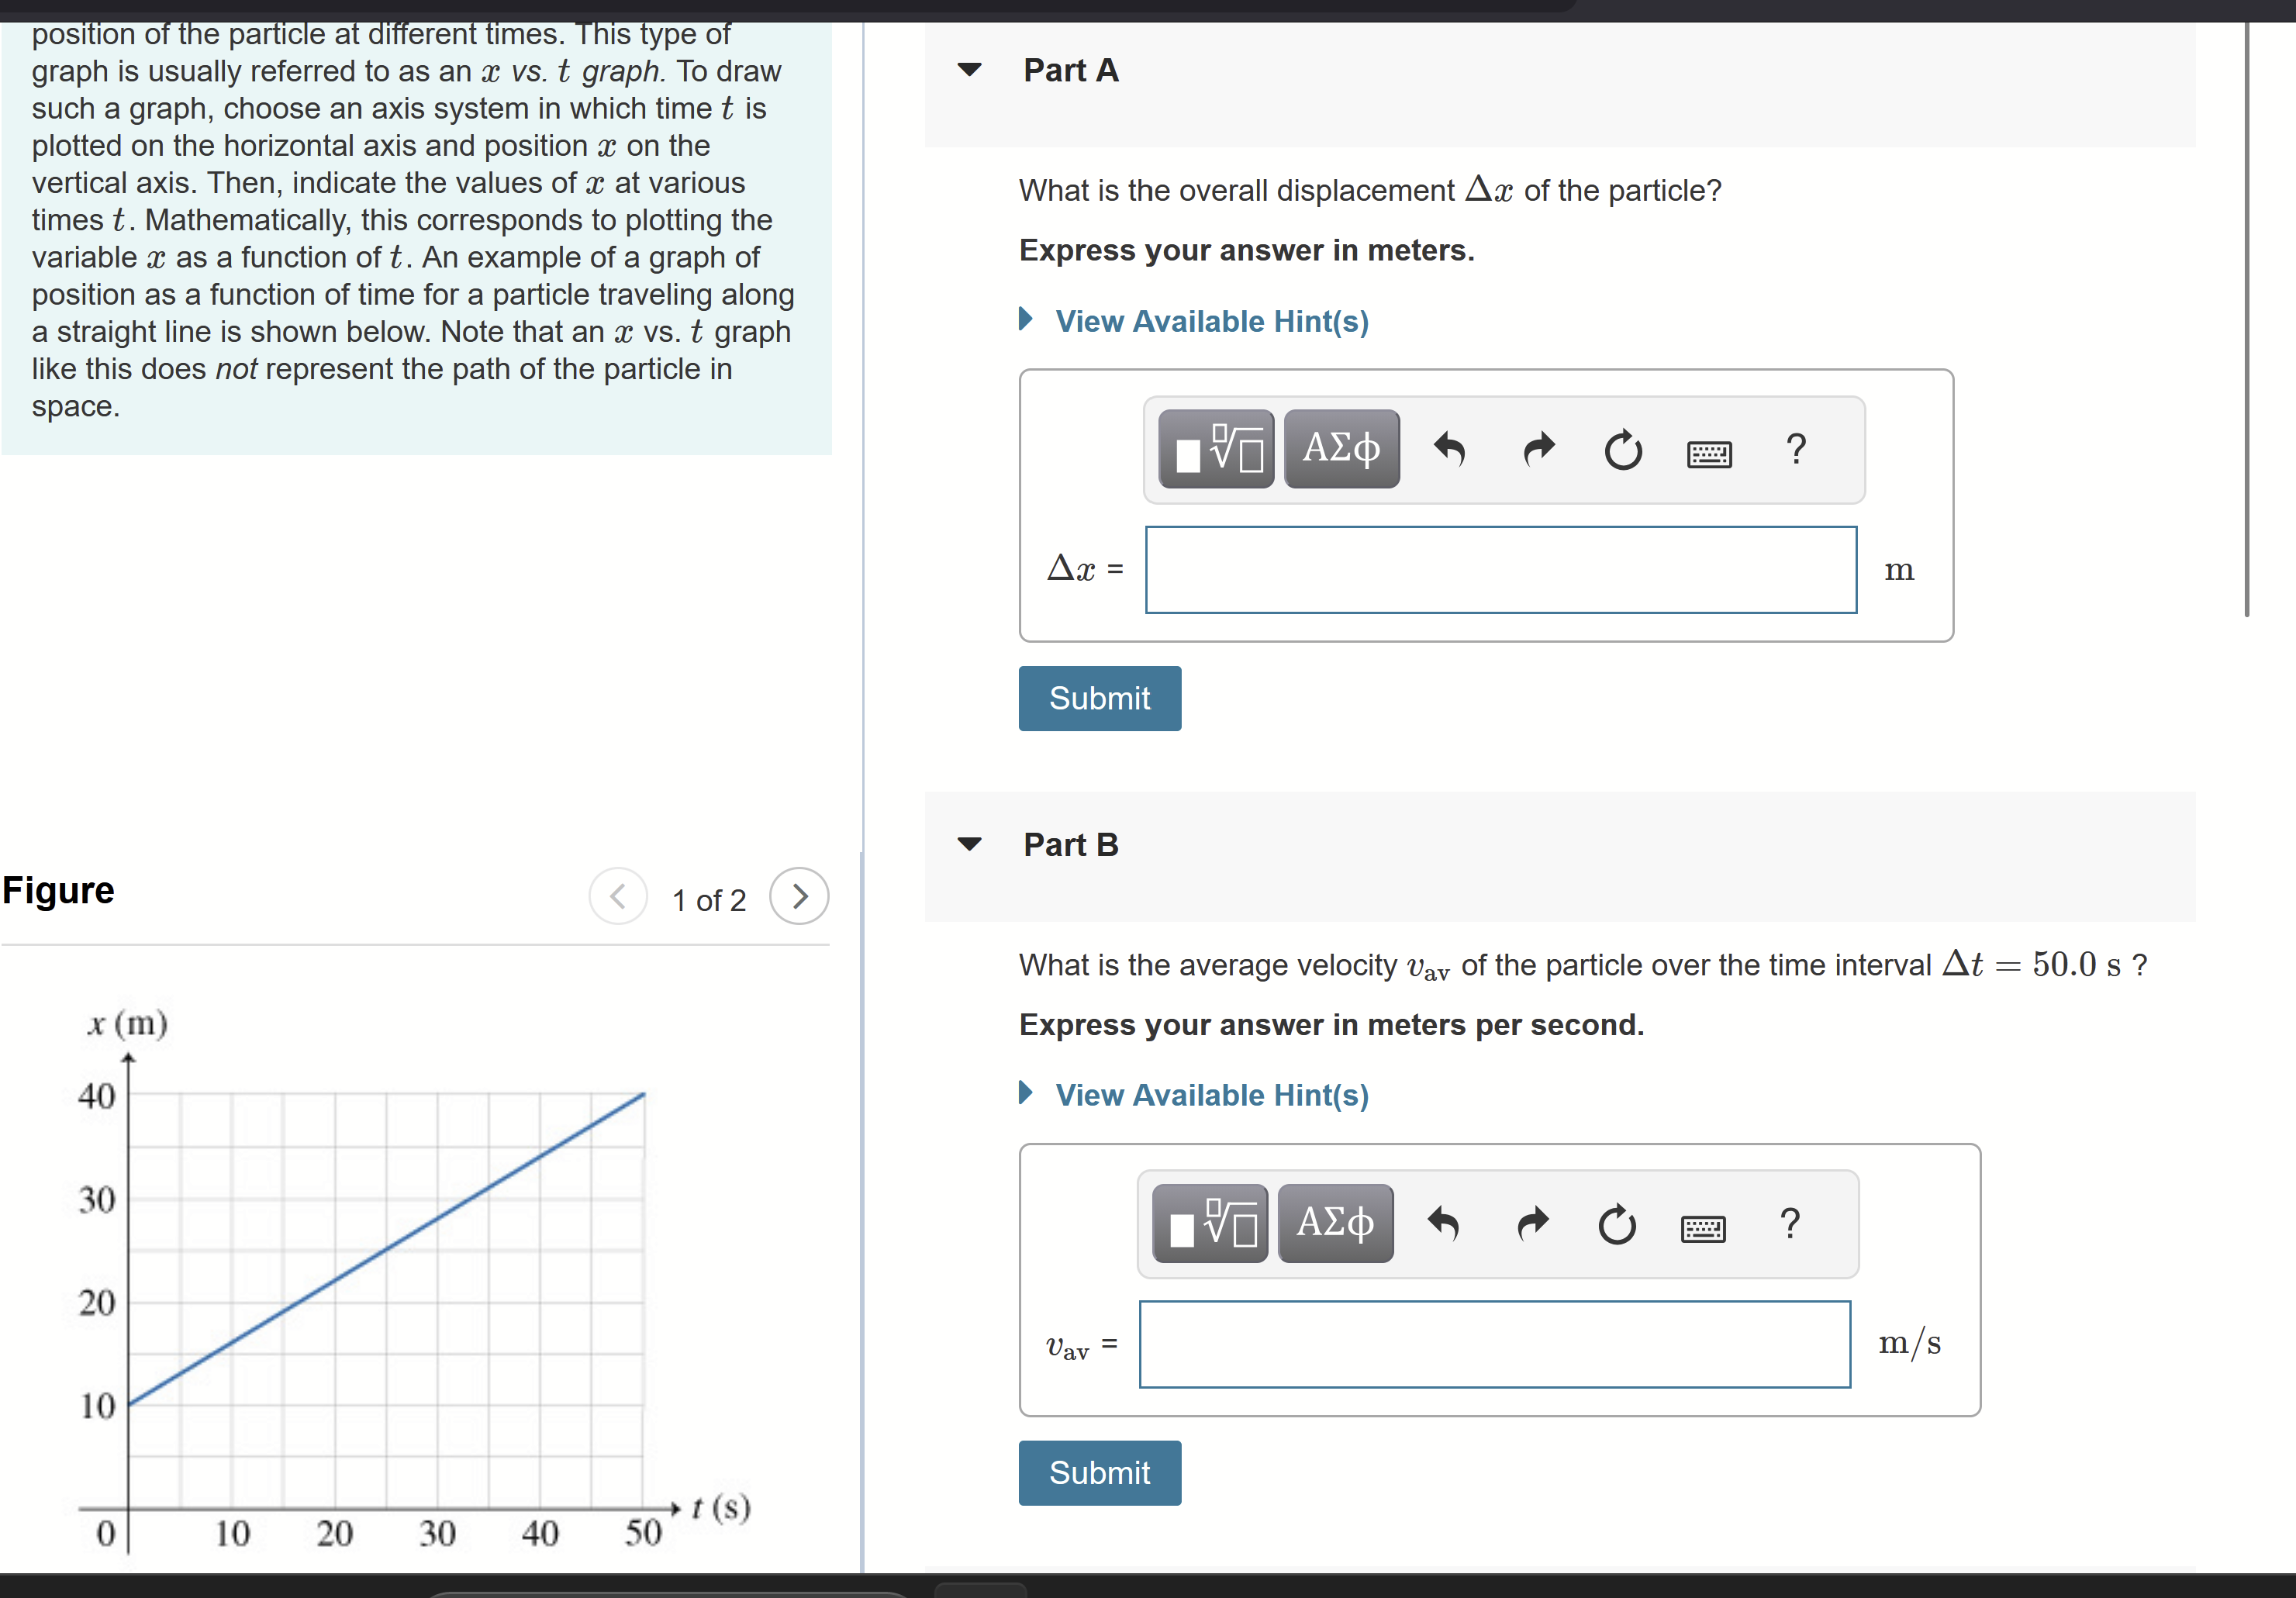
From the x vs. t (position vs. time) graph described in the source text, where the line goes from (t = 0 s, x = 10 m) to (t = 50 s, x = 40 m), what is the average velocity $v_{av}$ of the particle over $\Delta t = 50.0\,\text{s}$ (in m/s)?
The average velocity is the slope of the $x$ vs. $t$ graph: $v_{av}=\Delta x/\Delta t=(40-10)\,\text{m}/50.0\,\text{s}=0.600\,\text{m/s}$.
What the graph tells you
On an $x$ vs. $t$ (position vs. time) graph, the average velocity over a time interval equals the change in position divided by the change in time. For a straight line segment, this is also the line’s slope.
Read the two endpoints from the described figure
The line goes from:
- Initial point: $t_1=0\,\text{s}$, $x_1=10\,\text{m}$
- Final point: $t_2=50\,\text{s}$, $x_2=40\,\text{m}$
Compute average velocity (slope)
Compute the changes:
$$\Delta x = x_2-x_1 = 40-10 = 30\,\text{m}$$ $$\Delta t = t_2-t_1 = 50-0 = 50\,\text{s}$$
Then:
$$v_{av}=\frac{\Delta x}{\Delta t}=\frac{30\,\text{m}}{50\,\text{s}}=0.600\,\text{m/s}$$
Sign check
Because position increases from $10\,\text{m}$ to $40\,\text{m}$, $\Delta x>0$, so the average velocity is positive.

- Acceleration when stopping from 83 km/h in 4.0 s
- Instantaneous Speed vs Average Speed (13.5 mph)
- Speed of an Object Dropped from 10 m (Free Fall)
- Time of Flight and Maximum Height (Tower Throw)
- Average Acceleration of Blood in a Heart Stroke
- Does Constant Acceleration Mean a Straight-Line Path?
- Projectile Maximum Height — Ball Thrown Upward at 12 m/s
- Displacement From an x vs. t Graph (10 m to 40 m)
Comments (0)
Please to leave a comment.