
Using an appropriate diagram, explain the five phases of the business cycle
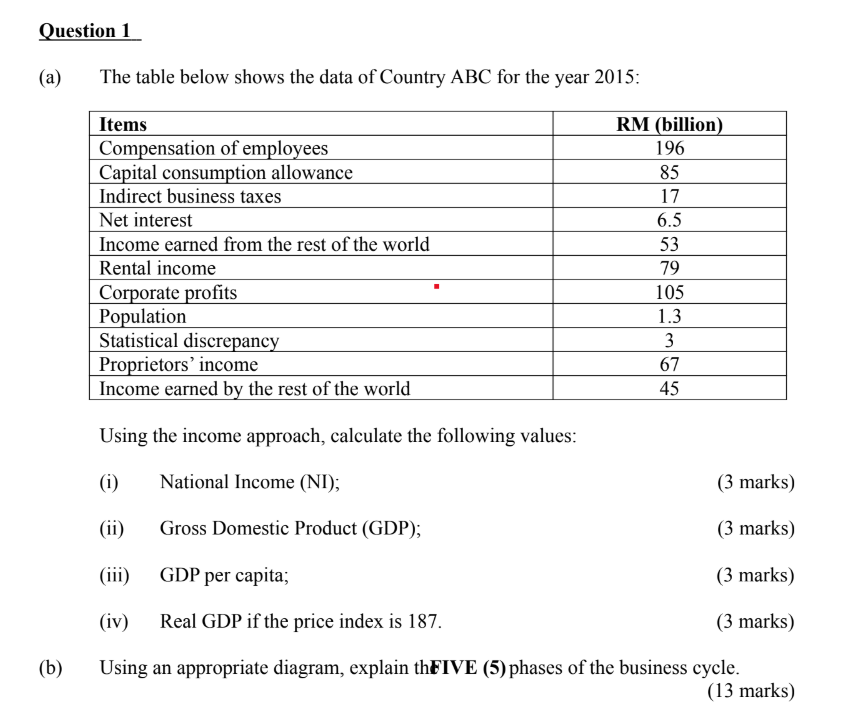
The five phases of the business cycle are expansion (recovery), peak (boom), contraction (recession), trough (depression), and recovery back into expansion. In a typical output-over-time diagram, real GDP rises during expansion, reaches a high point at the peak, falls during contraction, hits a low point at the trough, then turns upward again as recovery begins. Each phase is also linked to changes in employment, inflation, business confidence, and investment spending.
What you are being asked to show
You need to (1) draw a simple business cycle diagram (economic activity over time) and (2) describe what is happening in the economy in each of the five labelled phases.
A simple business cycle diagram (real GDP over time)
Below is a common sketch showing economic activity (often measured by real GDP) rising and falling over time.
Economic activity
(real GDP) ^
 | Peak (boom)
 | /\
 | / \
 | Expansion / \ Contraction
 | (recovery)/ \ (recession)
 | / \
 | / \
 | / \
 | / \
 | / \
 | / \
 | / \
 | Trough (depression) \
 +------------------------------------------------> Time
 Recovery begins here
Phase 1: Expansion (upswing)
In the expansion phase, real GDP increases, firms raise output, and new jobs are created, so unemployment tends to fall. Consumer spending and business investment usually rise because confidence and expected profits improve. Inflation may start to increase if demand grows faster than the economy’s ability to produce.
Phase 2: Peak (boom)
The peak is the turning point at the top of the cycle where economic activity is at a very high level. Capacity use is high, unemployment is low, and wages and prices often rise faster, so inflationary pressure can be strong. Because costs and interest rates may rise and demand may start to level off, the economy becomes vulnerable to a slowdown.
Phase 3: Contraction (downswing or recession)
During contraction, real GDP falls for a sustained period, businesses cut production, and unemployment rises. Household income growth slows, so consumption weakens, and firms reduce investment because profits and confidence decline. Inflation often eases, though in some cases prices can still be high early in a downturn.
Phase 4: Trough (depression/lowest point)
The trough is the bottom turning point where economic activity is at its lowest relative to the previous peak. Unemployment is typically high, many firms operate below capacity, and business confidence is weak. The downturn stops getting worse here, and conditions set up for a gradual improvement.
Phase 5: Recovery (early expansion)
Recovery is the phase right after the trough when output starts rising again and the economy moves back into expansion. Hiring begins to increase, spending and investment pick up, and confidence improves as profits recover. Over time, recovery can strengthen into a full expansion and the next cycle continues.
Quick summary of what usually changes across phases
- Output (real GDP): rises in expansion/recovery, falls in contraction, lowest at trough, highest at peak.
- Unemployment: falls in expansion, lowest near peak, rises in contraction, highest near trough.
- Inflation: often rises late in expansion/at peak, tends to fall during contraction (pattern can vary by shock).

- S–I Diagram: Higher Consumer Saving and Real Interest
- Marginal Cost From Total Cost and Output Change
- Open Market Purchase by the Fed: Money Supply Effect
- Short-Run Profit Maximization and Firm Entry Assumption
- Why Firms Produce with Losses (Short-Run Rule)
- Oranges Price Elasticity of Demand (PED) — Solved
- Per-Unit Cigarette Tax and Tax Revenue: True/False
- Utilità U=XY²: paniere ottimo ed effetti del prezzo
Comments (0)
Please to leave a comment.