
In the monopolistic competition diagram described (TR = $2800 at P = $28 and Q = 100, and ATC = $22 at Q = 100), what are the total costs and economic profits for the firm?
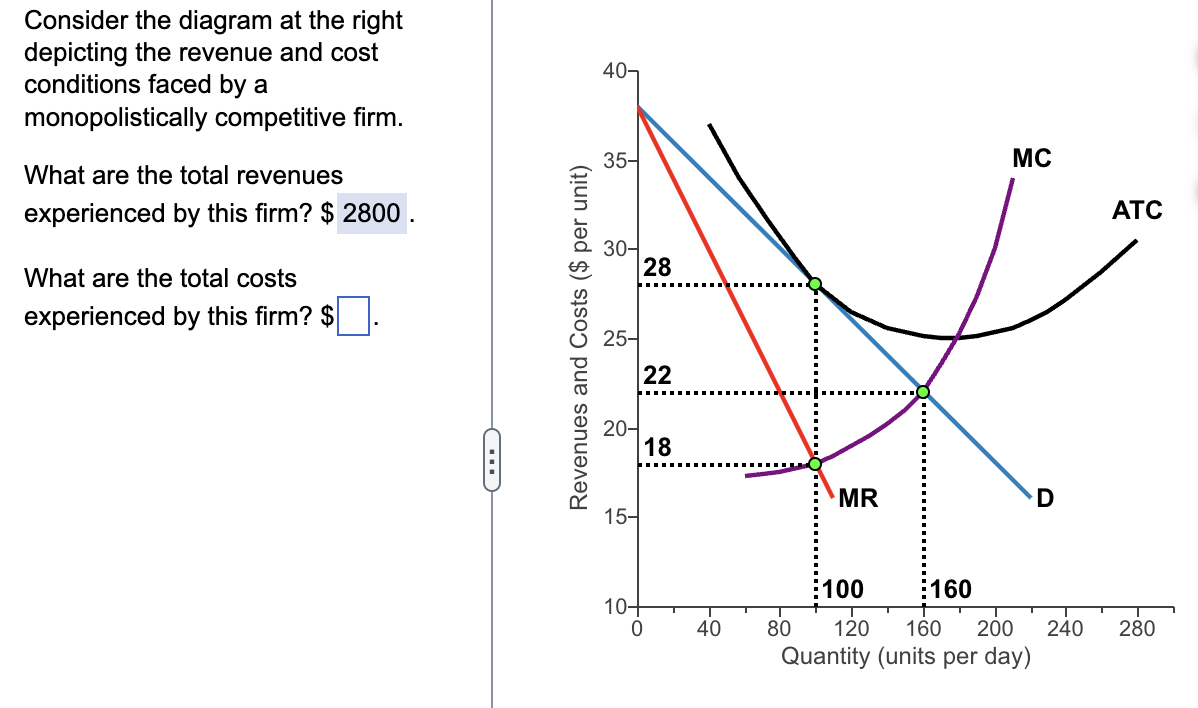
Total cost is $2200 and economic profit is $600. Since $TR = P\times Q = 28\times 100 = 2800$ and $ATC = 22$ at $Q=100$, total cost is $TC = ATC\times Q = 22\times 100 = 2200$. Economic profit equals $\pi = TR - TC = 2800 - 2200 = 600$.
What the diagram is telling you
To find economic profit from a monopolistic competition graph, you read the firm’s price and quantity (to get total revenue), then read $ATC$ at that same quantity (to get total cost).
Total revenue from price and quantity
From the prompt, total revenue is already given as $TR = \$2800$, which is consistent with: $$TR = P\times Q = 28\times 100 = 2800.$$
Total cost from the ATC curve
At the output level $Q=100$, the diagram indicates $ATC = \$22$ per unit. So: $$TC = ATC\times Q = 22\times 100 = 2200.$$
Economic profit (or loss)
Economic profit is: $$\pi = TR - TC = 2800 - 2200 = 600.$$ Because this value is positive, the firm earns an economic profit of $\$600$.

- Why Firms Produce with Losses (Short-Run Rule)
- Capital goods are purchased by firms: True or False
- Will Vegetable Supply Increase After Health Diet News?
- Price Elasticity of Supply from $1 to $3 (Table)
- Minimum Price Above Equilibrium: Surplus or Shortage?
- Equilibrio e imposta con U(X,Y)=(X-2)Y | Micro
- Price Elasticity of Supply (PES) Calculation | Table 3
- Elasticity of Supply: 0.75 and a 20% Price Rise
Comments (0)
Please to leave a comment.