
AI-Verified Solution
112 views
In the bar chart of wheat harvested at Sites A, B, and C from 1990 to 1993, what was the total wheat harvested over the four years at Site B?
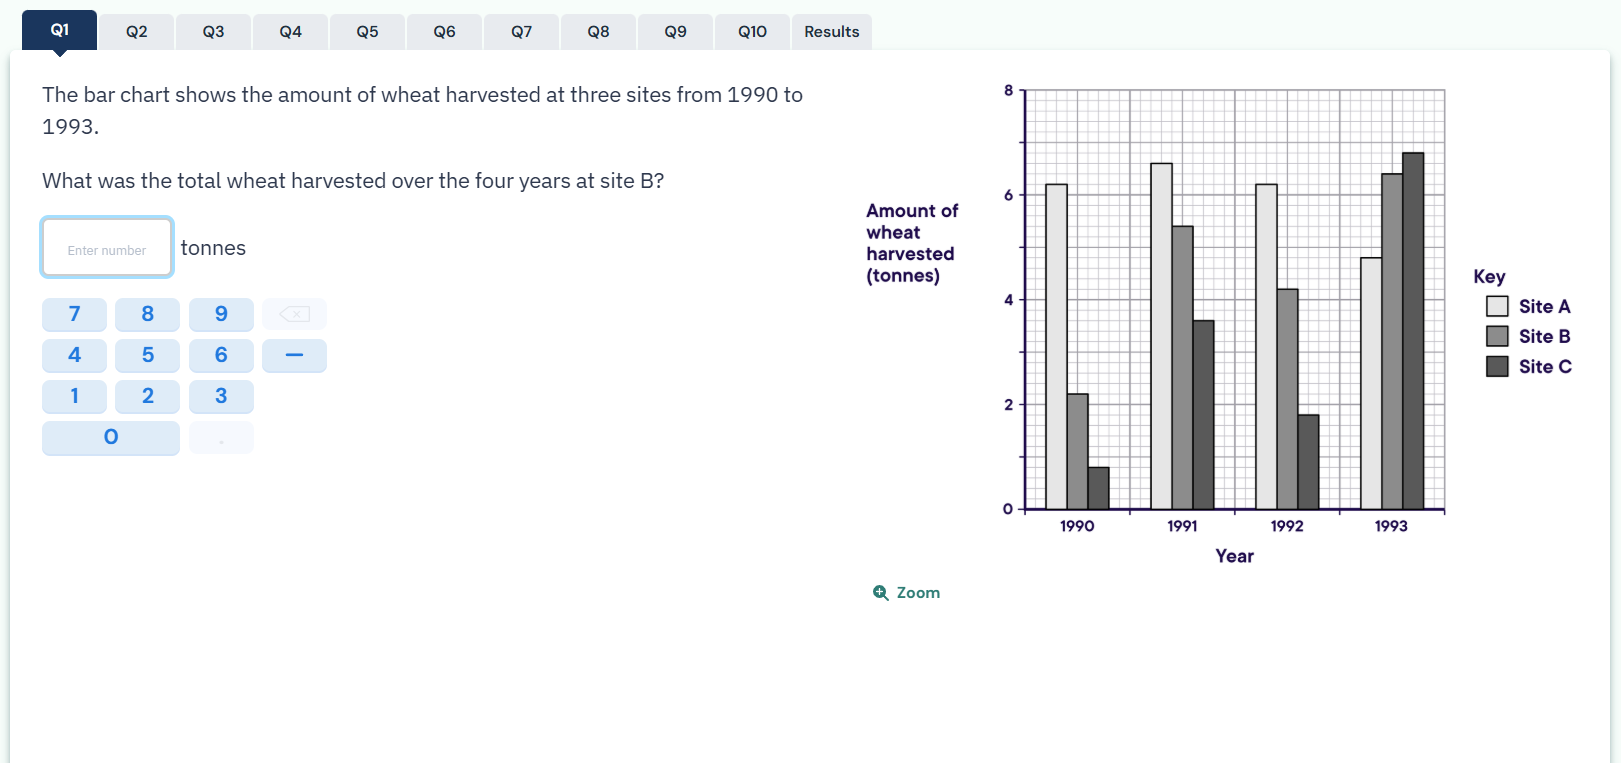
The bar chart shows the amount of wheat harvested at three sites from 1990 to 1993. Amount of wheat harvested (tonnes) Key: Site A, Site B, Site C. Year: 1990, 1991, 1992, 1993. Wheat harvested at Sit...
The bar chart shows the amount of wheat harvested at three sites from 1990 to 1993. Amount of wheat harvested (tonnes) Key: Site A, Site B, Site C. Year: 1990, 1991, 1992, 1993. Wheat harvested at Site A: 1990 - 6.5, 1991 - 5, 1992 - 4.5, 1993 - 6. Wheat harvested at Site B: 1990 - 1, 1991 - 7, 1992 - 4, 1993 - 5.5. Wheat harvested at Site C: 1990 - 0.5, 1991 - 5.5, 1992 - 4, 1993 - 7.
Answer
The total wheat harvested at Site B from 1990 to 1993 is 17.5 tonnes. This comes from adding 1990 (1), 1991 (7), 1992 (4), and 1993 (5.5): $1 + 7 + 4 + 5.5 = 17.5$ tonnes.
Explanation
What you need to do
You are finding a 4-year total for Site B, so you add Site B’s values for 1990, 1991, 1992, and 1993.
Add Site B’s yearly harvest amounts
From the chart data for Site B:
- 1990: $1$ tonne
- 1991: $7$ tonnes
- 1992: $4$ tonnes
- 1993: $5.5$ tonnes
Now add them: $$ 1 + 7 + 4 + 5.5 = 17.5 $$
Total for Site B
So, the total wheat harvested at Site B over the four years is $17.5$ tonnes.

Want a deeper explanation? Ask our AI 👇
Skills You Achive
data interpretation
adding decimals
reading charts
basic arithmetic
Related Questions
- Incenter Angle Bisector Problem: Find m∠BCP
- Type of Data: Water Intake (L/day) From Cows
- Evaluate $h(-1)$ for $h(x)=-5x^3+x+2$
- Probability a Batch Is Accepted (3 Tested, 0 Failures)
- Conditional Probability From a Gender-Carrier Table
- AA Similarity Proof for △EFG ∼ △EHI
- Percentage and Cumulative Percentages for Water Intake
- Plot car value graph: £500 loses £80 per month
Comments (0)
Please to leave a comment.